WE ARE HIRING ...


DeltaMax V2.0 Overview (Azure Integration)
DeltaMax V2.0 is an advanced data quality and anomaly detection framework developed by KatalystStreet. It enables organizations to perform multi-period data validation, statistical drift detection, and machine learning–based anomaly identification.
This Azure-integrated version of DeltaMax is designed to work seamlessly with the Microsoft Azure ecosystem, replacing Google Cloud components with Azure-native services such as:
- ● Azure Blob Storage for scalable data storage
- ● Azure Synapse Analytics for data warehousing, querying visualization and reporting
- ● Azure Agent
Key Capabilities of DeltaMax V2.0
DeltaMax V2.0 provides a structured workflow that includes:
- 1. Multi-Period Data Generation (H–A–B Framework)
Generates Historical (H), Previous (A), and Current (B) datasets to enable drift and stability analysis.
- 2. Trust Score Computation
Combines anomaly signals, drift metrics, and data validation checks into a normalized, interpretable score.
- 3. Data Quality Checks
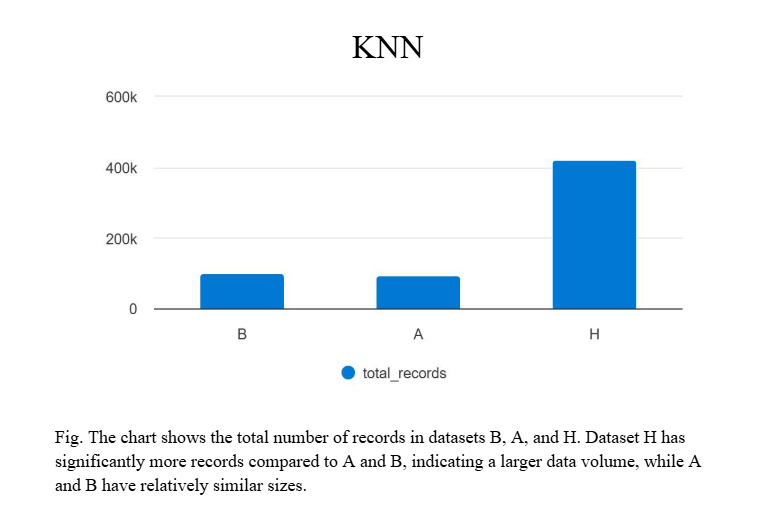
Performs statistical tests, KNN-based anomaly detection, PSI analysis, and structural validations.
- 4. Azure Integration
Automatically uploads processed datasets to Azure Blob Storage and loads them into Synapse tables for scalable analytics.
- 5. Visualization & Reporting
Enables real-time dashboards and insights using Power BI connected to Synapse Analytics.
End-to-End Azure Workflow
The DeltaMax Azure workflow ensures:
- ● Automated data generation and validation
- ● Seamless data transfer to cloud storage
- ● Direct integration with analytics and reporting tools
- ● Scalable and enterprise-ready architecture
All outputs generated by DeltaMax scripts are:
- ● Stored in Azure Blob Storage containers
- ● Loaded into Synapse Analytics tables
- ● Instantly available for reporting in Power BI
Azure Blob Storage & Synapse Analytics Integration.
All DeltaMax V2 scripts are already integrated with:
- ● Azure Blob Storage upload logic (replaces Google Cloud Storage)
- ● Azure Synapse Analytics / Dedicated SQL Pool table loading logic
- ● Automatic container/table creation (if configured)
Once the scripts are executed, outputs are:
- ● Uploaded to Azure Blob Storage containers
- ● Loaded into Azure Synapse Analytics tables
- ● Immediately available for reporting in Microsoft Power BI
Multi-Period Data Generation (H-A-B) Framework
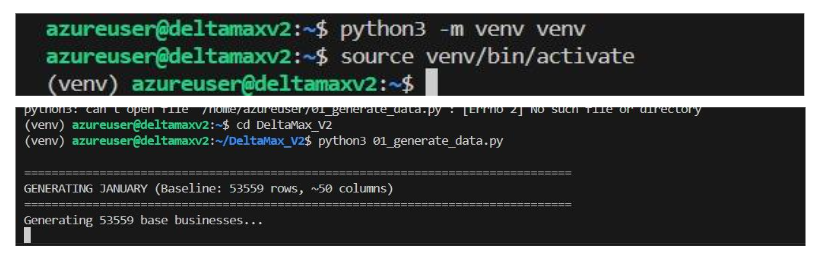
Step 1: DeltaMax_synthetic_data_generator.py
This step generates synthetic datasets from January to August, where January–June act as Historical (H), July is the Previous period (A), and August is the Current period (B). The August dataset includes controlled variations to simulate drift and anomalies for H–A–B risk evaluation.
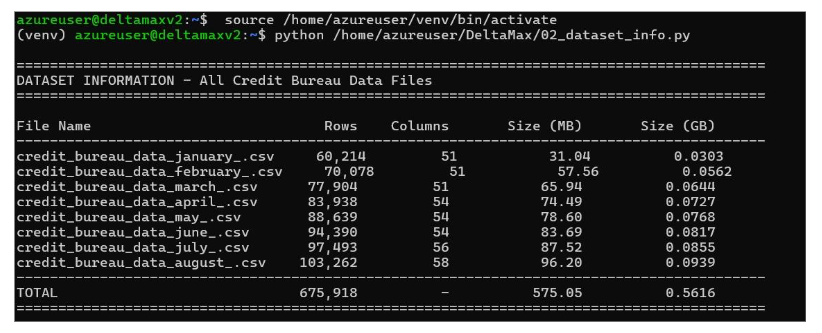
Step 2: Dataset Profiling & Structural Summary
This step scans all generated monthly datasets (January–August) and produces a consolidated structural summary, including row counts, column counts, storage size, and month-to-month entity churn.
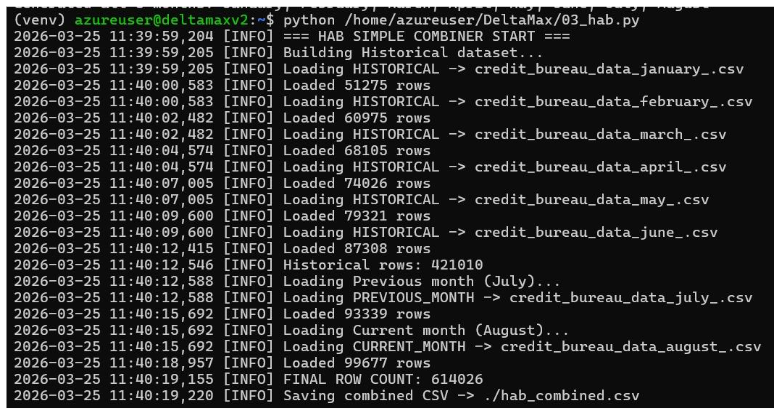
H–A–B Data Consolidation & Synapse Load (03_hab.py)
This step combines all monthly datasets into a single structured H–A–B master file to streamline downstream drift analysis, anomaly detection, and Trust Score computation.
Trust Score Computation
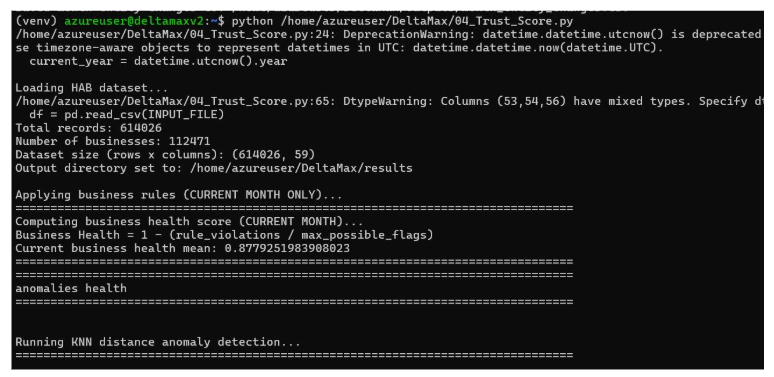
Step 3: Trust Score Computation (04_Trust_Score.py)
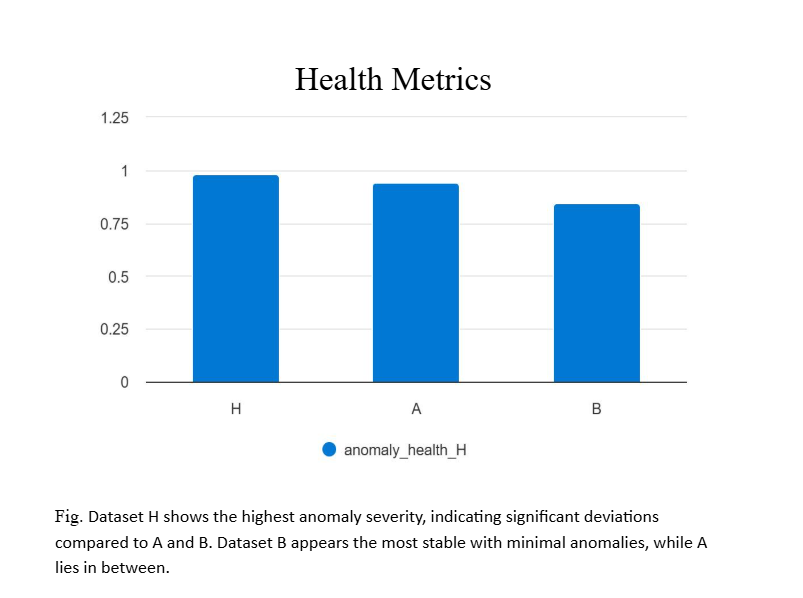
Executes anomaly detection, data integrity validation, and multi-period drift analysis (H–A–B) to quantify dataset stability and risk exposure.
It aggregates anomaly health, drift health, and business rule compliance into a weighted Trust Score (0–100), providing a single interpretable risk metric for the current month.
Data Quality Checks
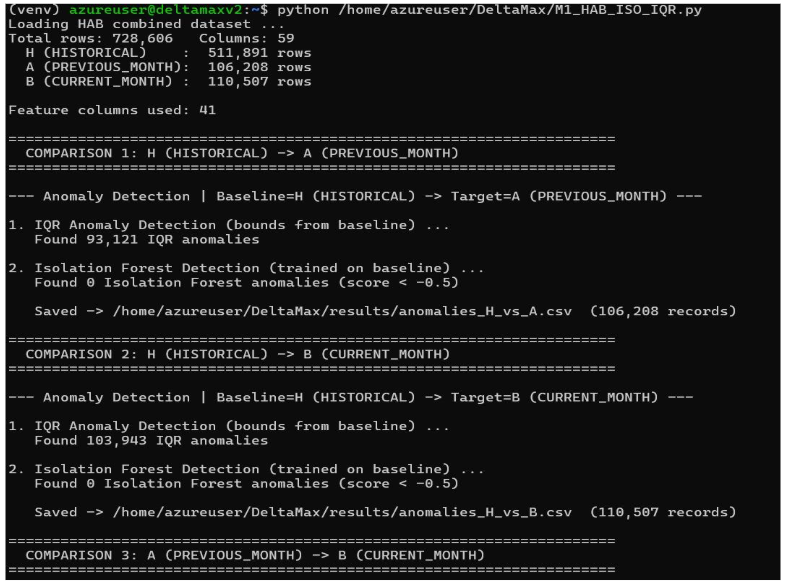
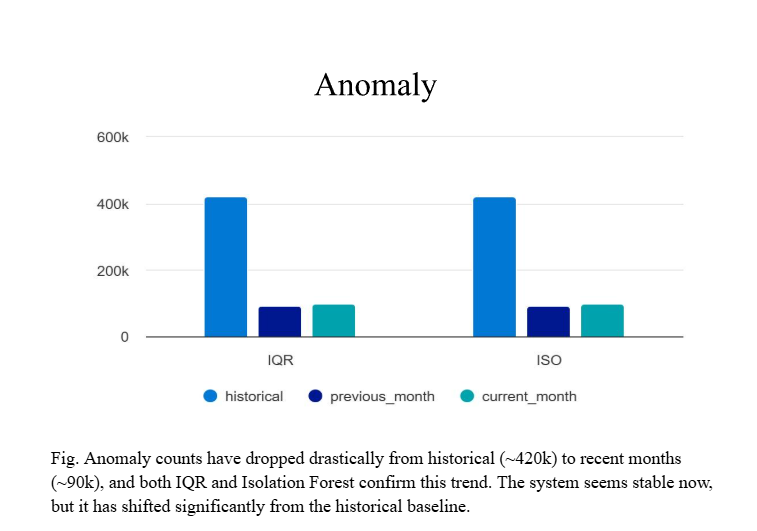
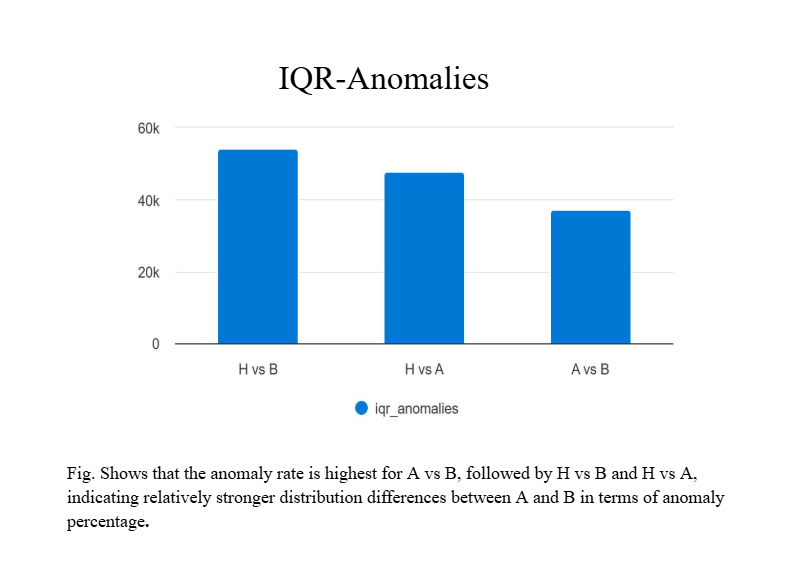
Step 4: Isolation Forest & IQR Anomaly Detection (M1_HAB_ISO_IQR.py)
Runs Isolation Forest and IQR-based outlier detection across H–A–B datasets to identify global and statistical anomalies in entity behavior.
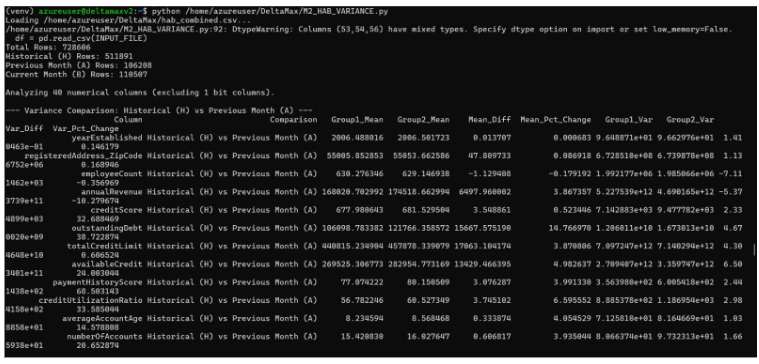
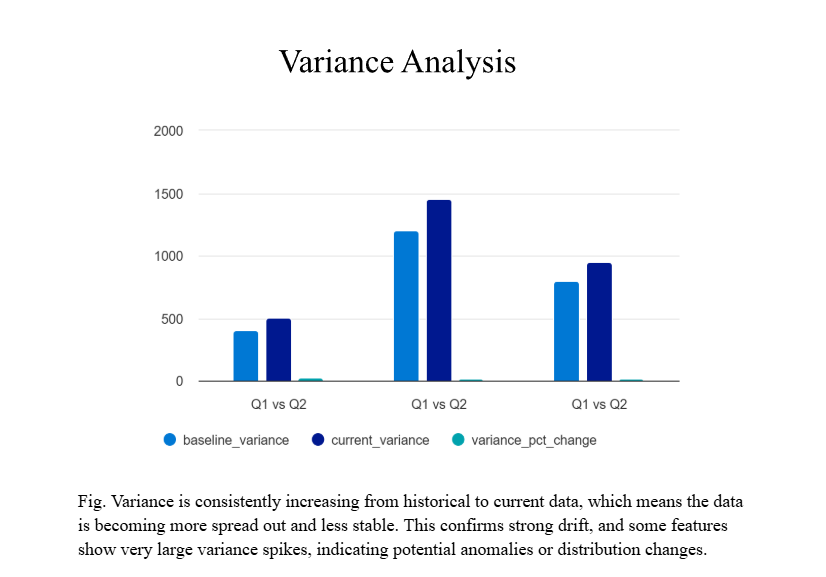
Step 5: Variance Drift Analysis (M2_HAB_VARIANCE.py)
Measures variance shifts across H–A–B periods to detect distribution instability and structural data changes.
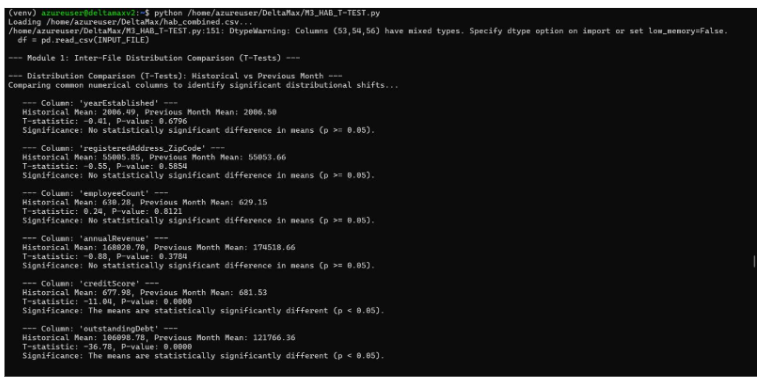
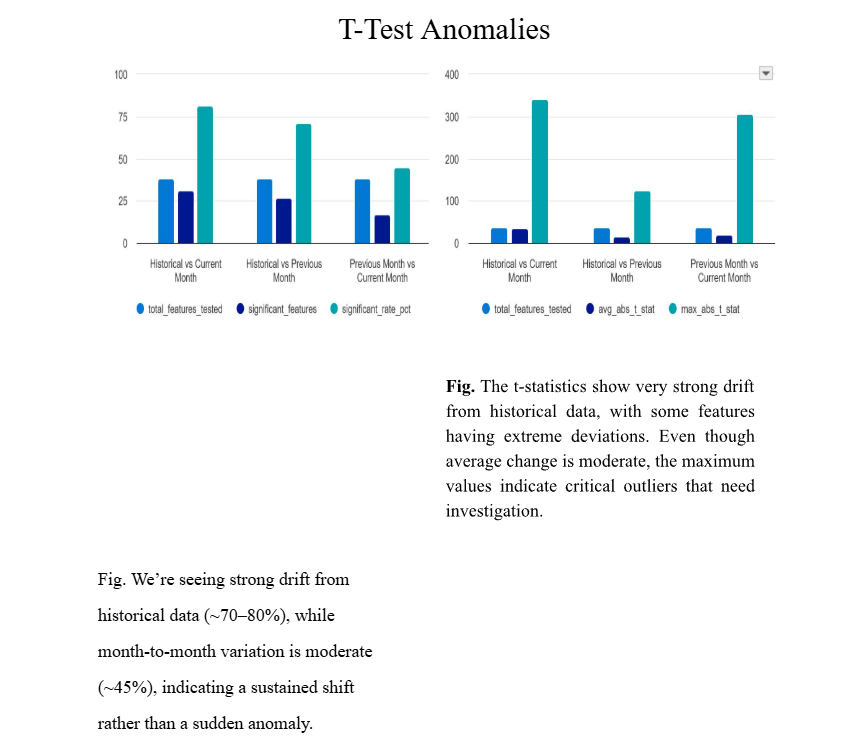
Step 6: Statistical T-Test Drift Detection (M3_HAB_T_TEST.py)
Performs Welch's T-test across periods to detect statistically significant mean shifts between Historical, Previous, and Current datasets
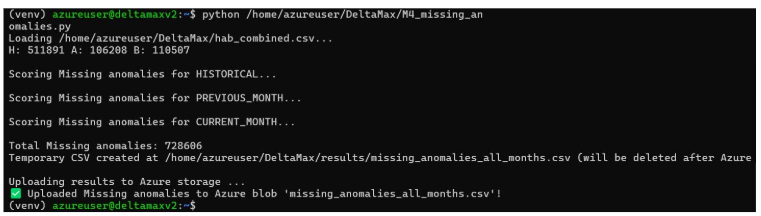
Step 7: Missing Value Anomaly Detection (M4_missing_anomalies.py)
Identifies abnormal missingness patterns in the current dataset compared to historical benchmarks.
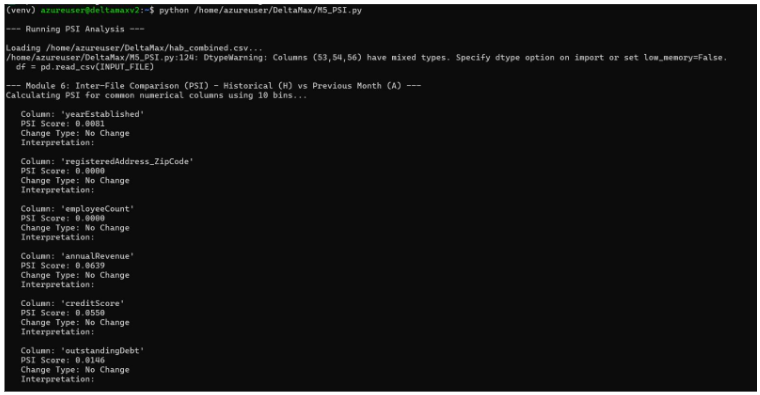
Step 8: Population Stability Index (PSI) Analysis (M5_PSI.py)
Calculates PSI scores to quantify distribution drift between H–A–B datasets and measure population stability.
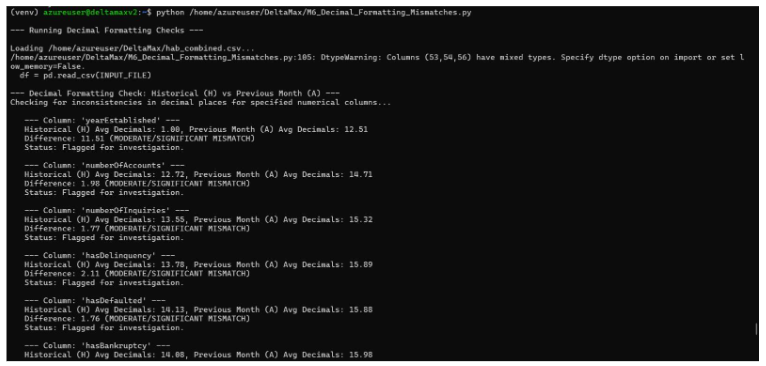
Step 9: Decimal Formatting Mismatch Detection (M6_Decimal_Formatting_Mismatches.py)
Detects numeric precision and decimal formatting inconsistencies between historical and current datasets.
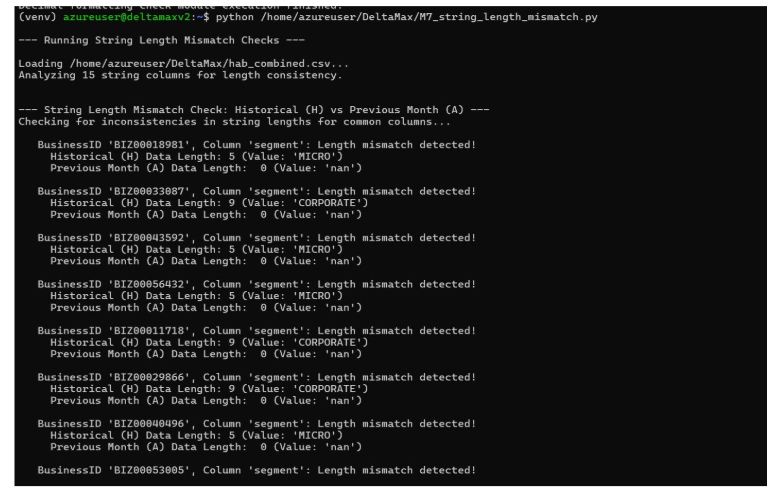
Step 10: String Length Anomaly Detection (M7_String_Length.py)
Validates string field consistency by detecting abnormal length deviations across structured text attributes.
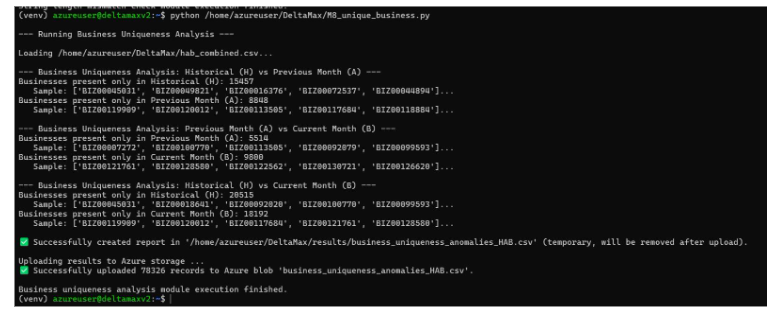
Step 11: Unique Business Integrity Check (M8_unique_business.py)
Ensures entity uniqueness and detects duplicate or conflicting business identifiers across H–A–B datasets.
Visualization & Agentic Intelligence
Step 12: Visualization through Azure Analytic Studio
Note: This visualization is an example of how the data can be perceived using our generated datasets on Azure Analytic Studio. It is intended to illustrate potential insights and patterns rather than represent finalized outputs.
For customized dashboards and tailored reporting, please reach out to KatalystStreet to help visualize your outputs effectively.


- Get Started
- Careers
- Contact Us
- Updates
- Blogs