WE ARE HIRING ...


DeltaMax V-2.0 Overview
This guide walks through the complete DeltaMax V2 workflow — from multi-period data generation using the H–A–B framework, to advanced anomaly detection with KNN, Trust Score computation, and seamless integration with Google Cloud for visualization and AI-powered analysis.
DeltaMax V2 is designed to enable structured data validation, statistical drift detection, machine learning–based anomaly identification, and business-level risk interpretation.
It provides the commands and structure required to run each step end-to-end and adapt it to your project setup.
The workflow is organized into five core sections:
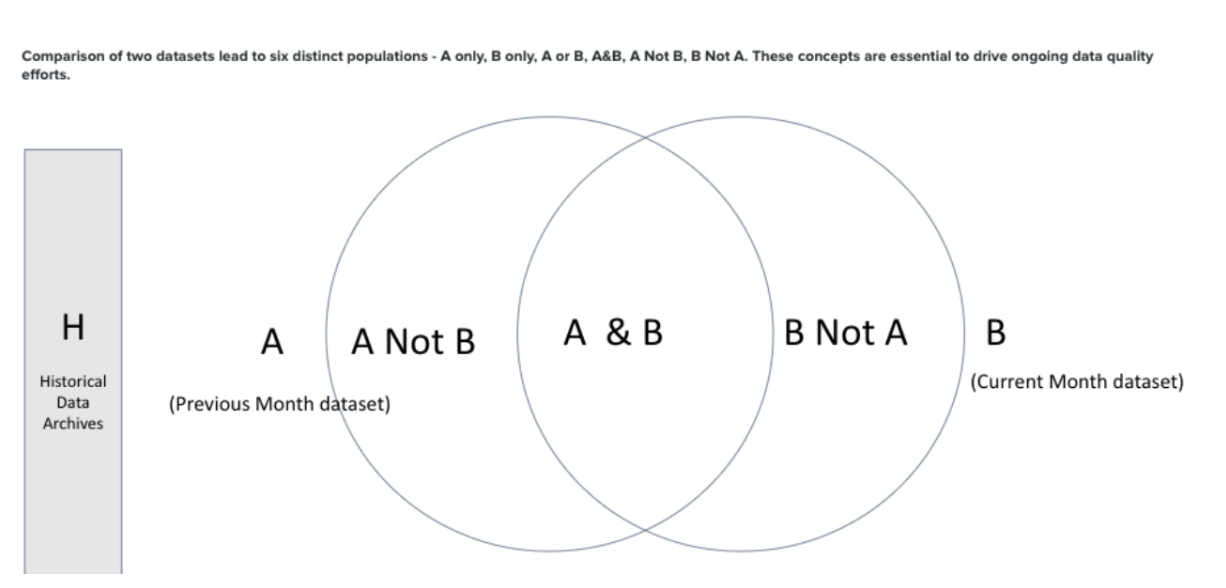
1.Multi-Period Data Generation (H–A–B Framework) - Generates Historical (H), Previous (A), and Current (B) datasets to enable structured drift and stability comparison.
2.Trust Score Computation- Combines anomaly signals, drift metrics, and data integrity checks into a normalized, interpretable risk score.
3.Data Quality Checks- Executes KNN anomaly detection, statistical tests, PSI analysis, and structural validations to detect inconsistencies and risk signals.
4.Google Cloud & BigQuery Integration- Operationalizes outputs through Cloud Storage ingestion and BigQuery modeling for scalable analytics.
Step-1 : Search for DeltaMax on Google Cloud Marketplace

1. You will need to create a project on Google Cloud
2. The project should be associated with your corporate billing account.
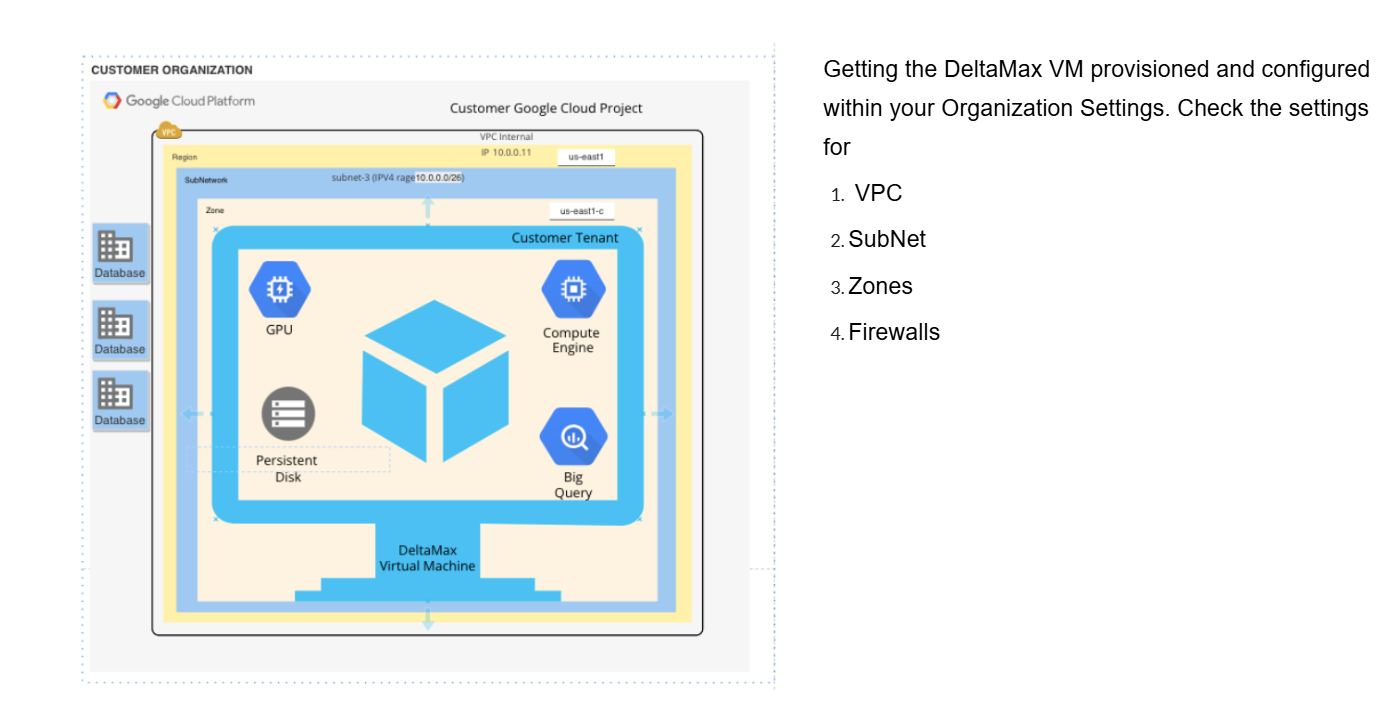
Step-2 : Deploy the DeltaMax Virtual Machine in your Organization
Step-3 : Ensure that VM is updated, if required install python3-full latest version, venv

Google Cloud Storage & BigQuery Integration
Google Cloud Storage & BigQuery Integration
All DeltaMax V2 scripts are already integrated with:
- ● Google Cloud Storage (GCS) upload logic
- ● BigQuery table loading logic
- ● Automatic dataset/table creation (if configured)
Once the scripts are executed, outputs are:
- ● Uploaded to GCS
- ● Loaded into BigQuery
- ● Immediately available for reporting in Looker Studio
Multi-Period Data Generation (H–A–B Framework)
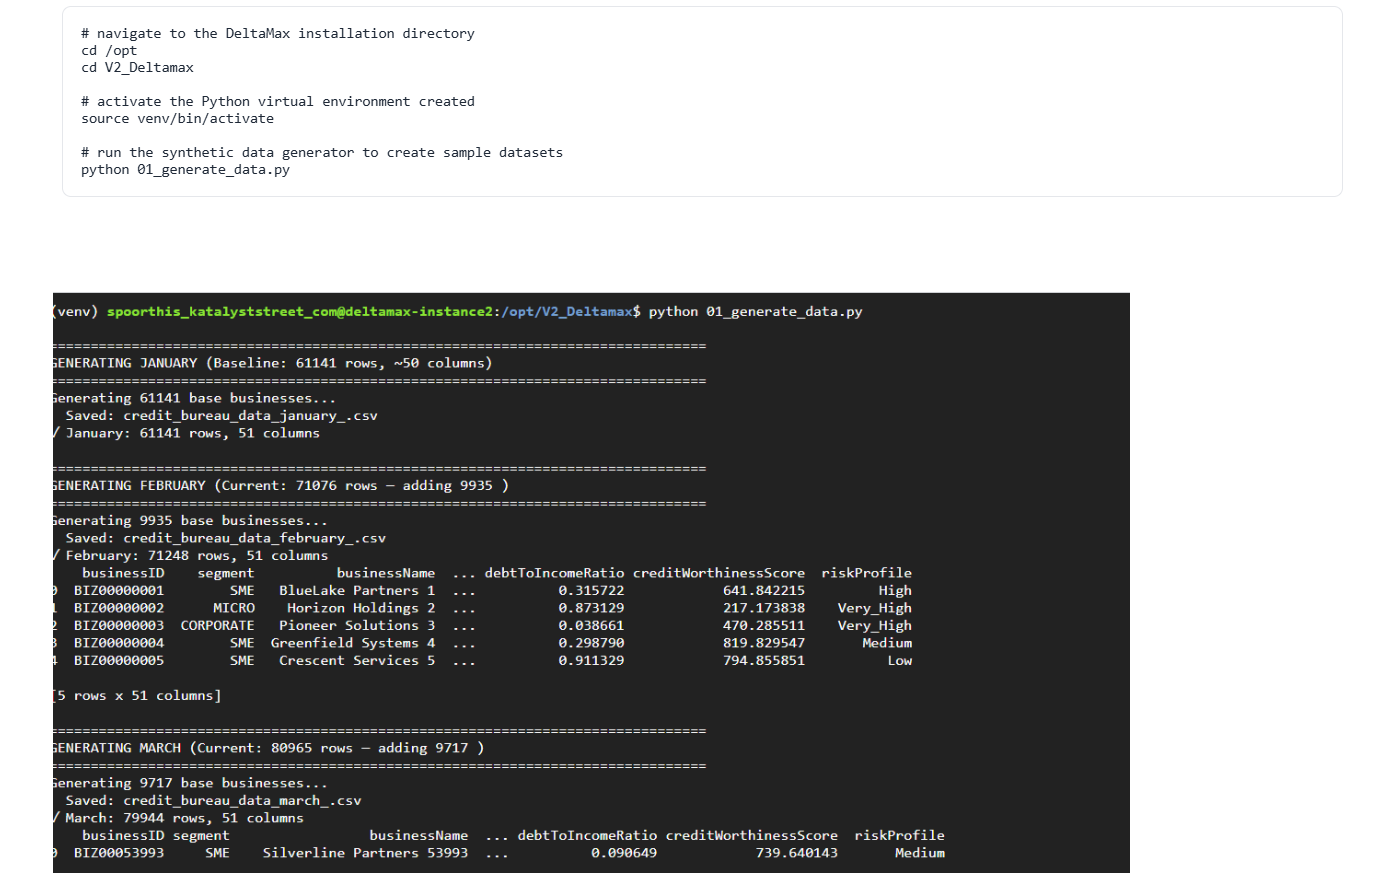
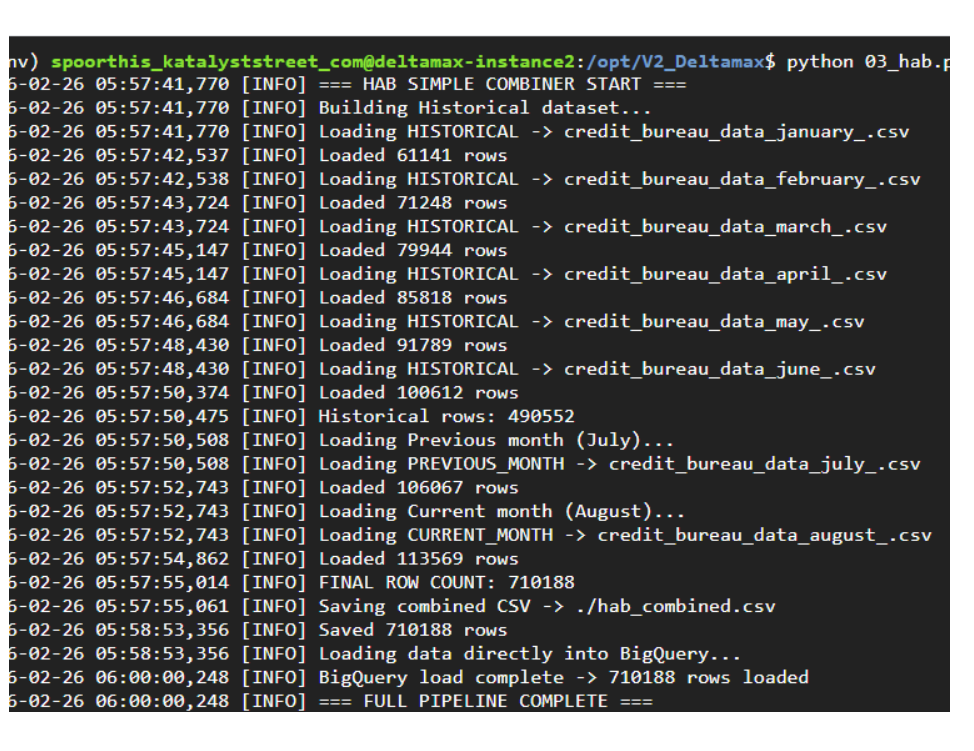
Step-4 : DeltaMax_synthetic_data_generator.py
This step generates synthetic datasets from January to August, where January–June act as Historical (H), July is the Previous period (A), and August is the Current period (B). The August dataset includes controlled variations to simulate drift and anomalies for H–A–B risk evaluation.
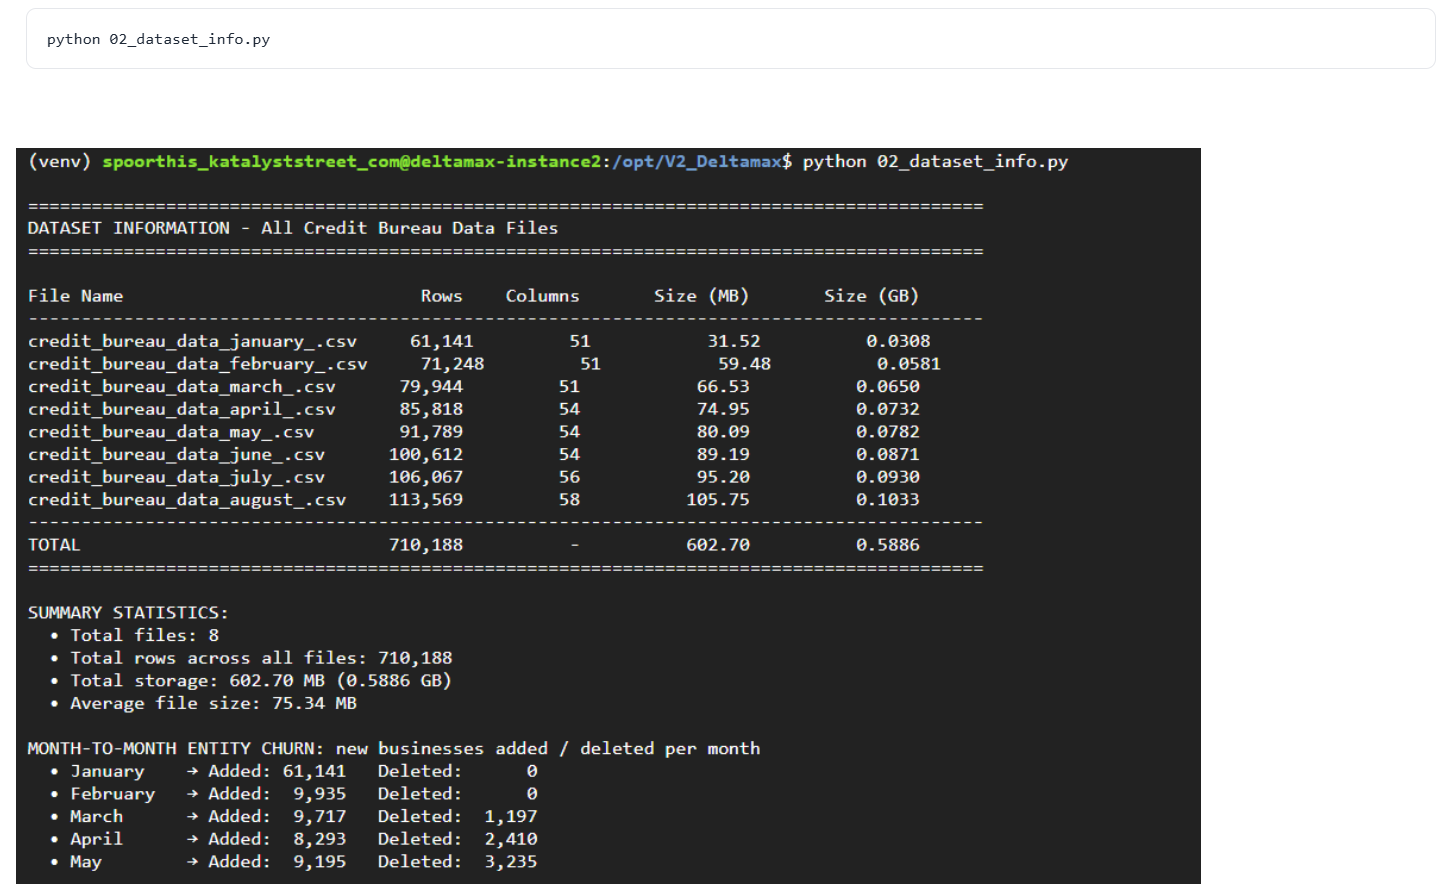
Step-5 : Dataset Profiling & Structural Summary
This step scans all generated monthly datasets (January–August) and produces a consolidated structural summary, including row counts, column counts, storage size, and month-to-month entity churn.
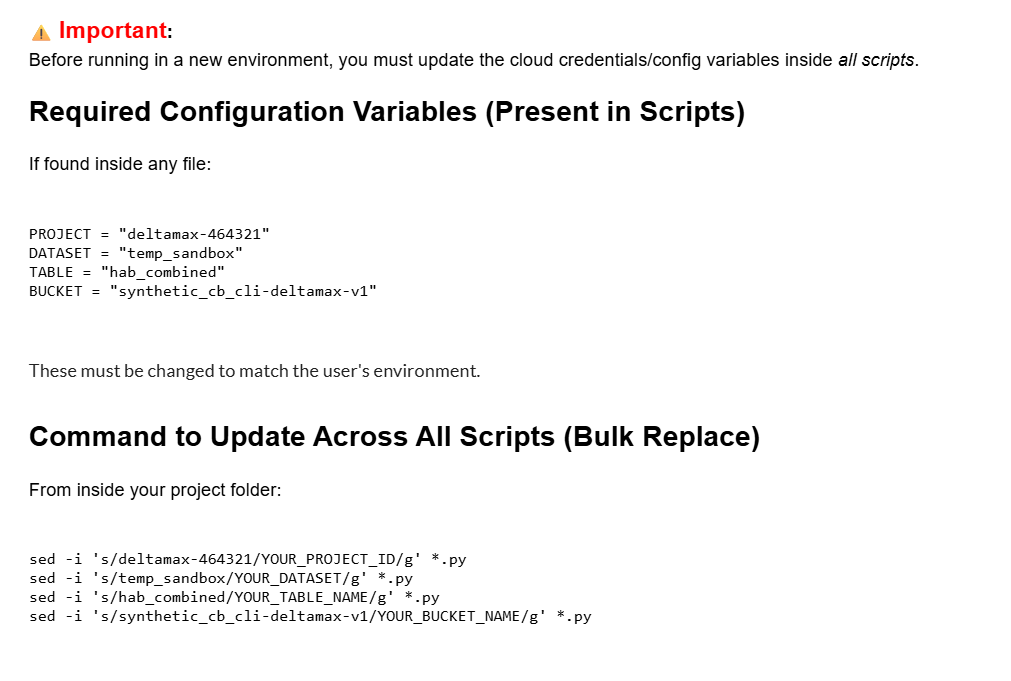
Important Configuration Note : BigQuery integration credentials are defined directly inside the script.
Before running in your environment, open the file using nano or vim and update the project configuration accordingly.
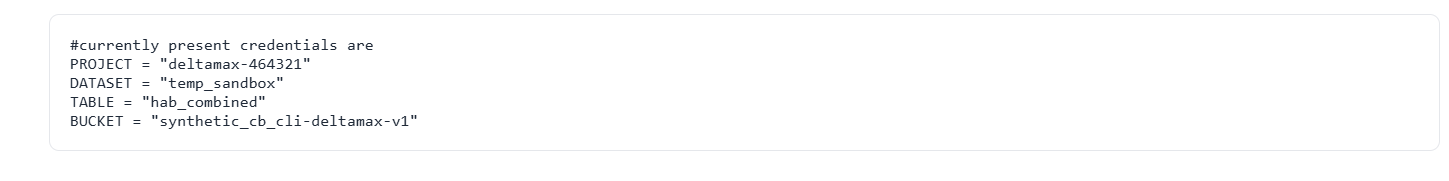
If deploying in a different environment, make sure to update:
- ● Google Cloud Project ID
- ● BigQuery Dataset name
- ● Target Table name
- ● Cloud Storage Bucket
Failure to update these values will result in incorrect project uploads.
Trust Score Computation
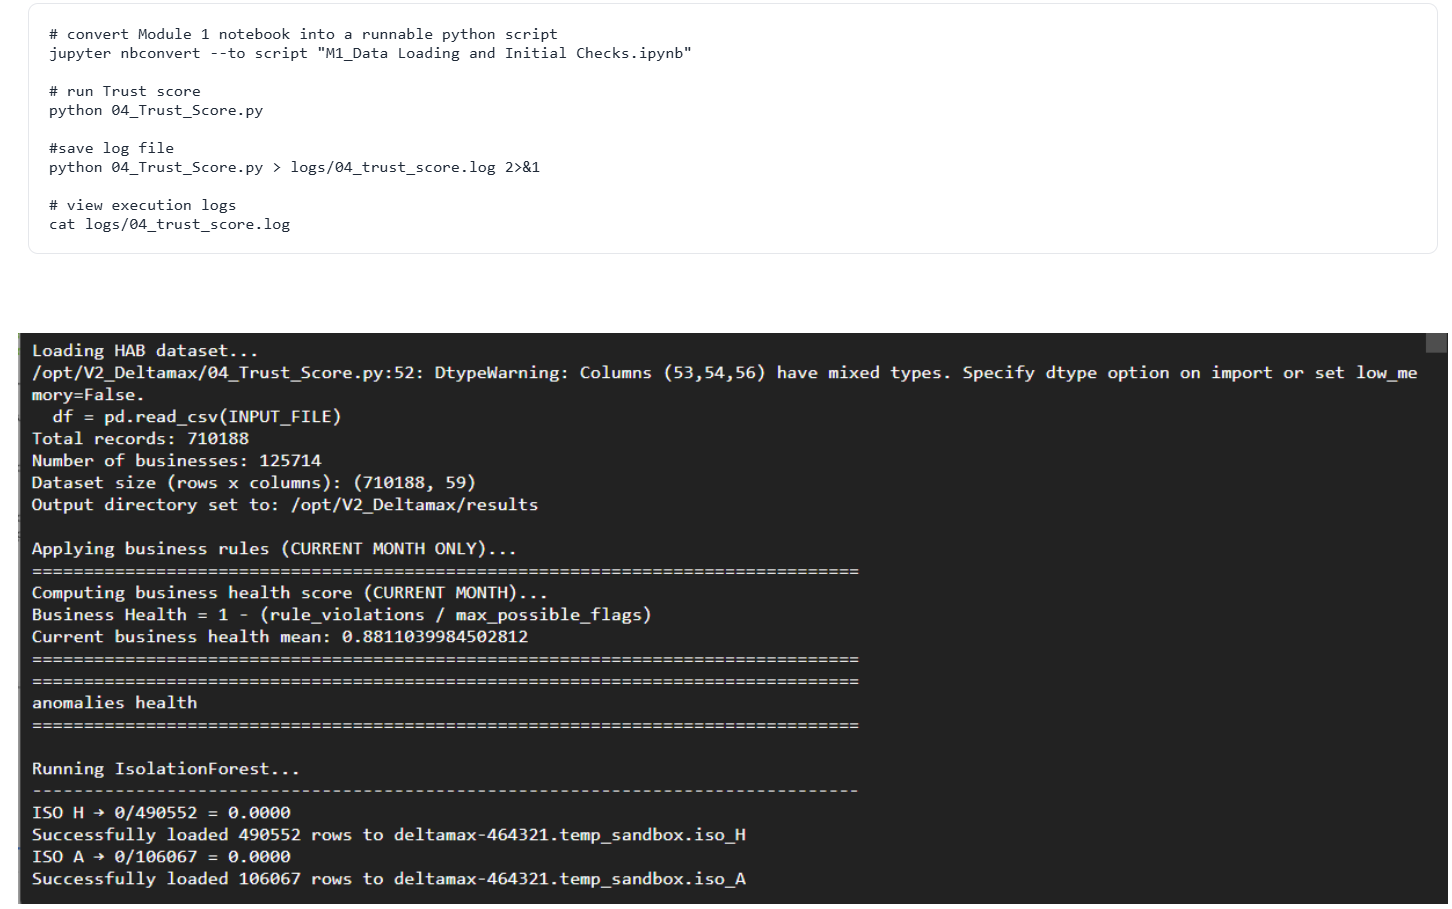
Step-6 : Trust Score Computation (04_Trust_Score.py)
Executes anomaly detection, data integrity validation, and multi-period drift analysis (H–A–B) to quantify dataset stability and risk exposure.
It aggregates anomaly health, drift health, and business rule compliance into a weighted Trust Score (0–100), providing a single interpretable risk metric for the current month.
Data Quality Checks
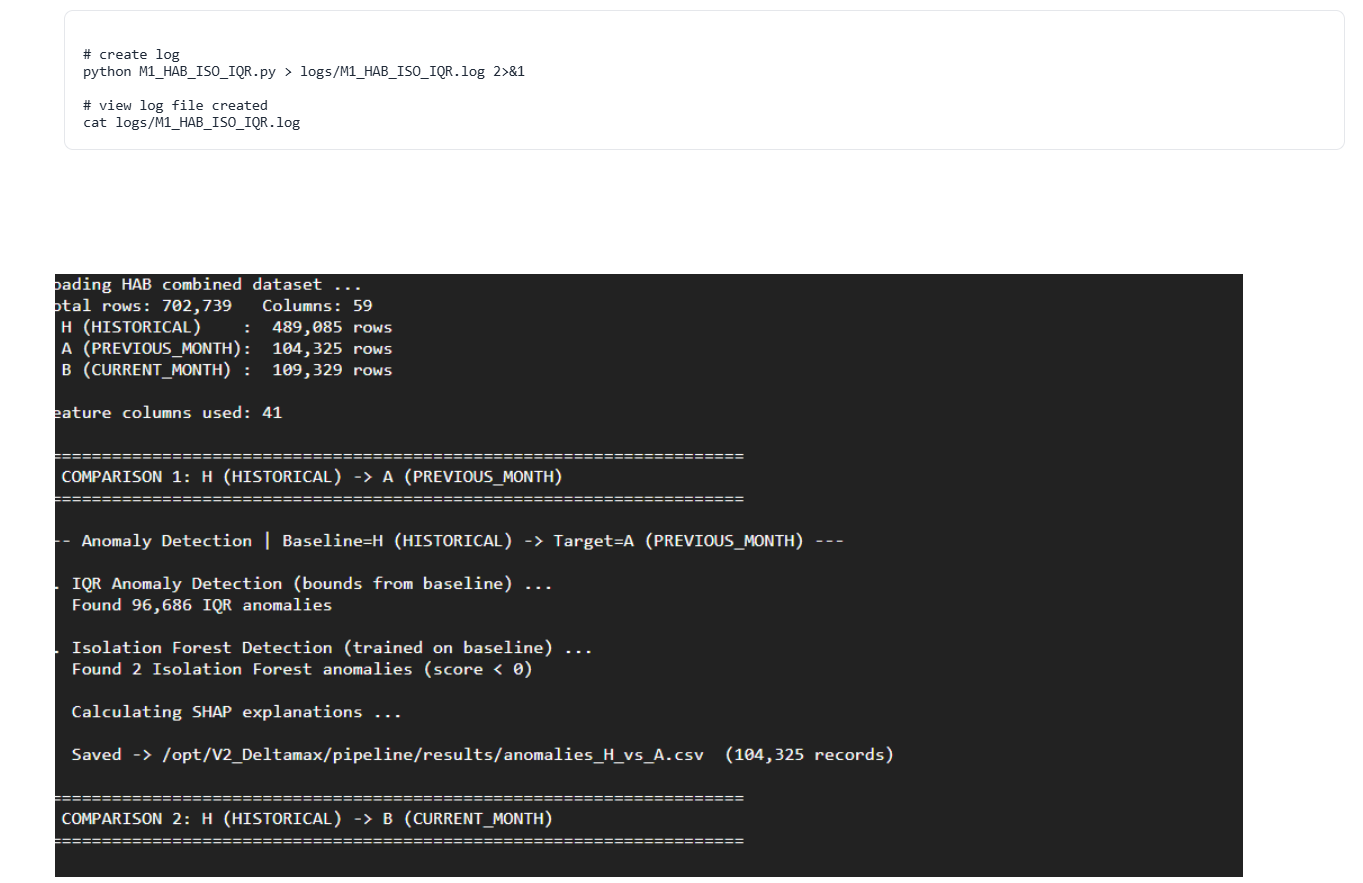
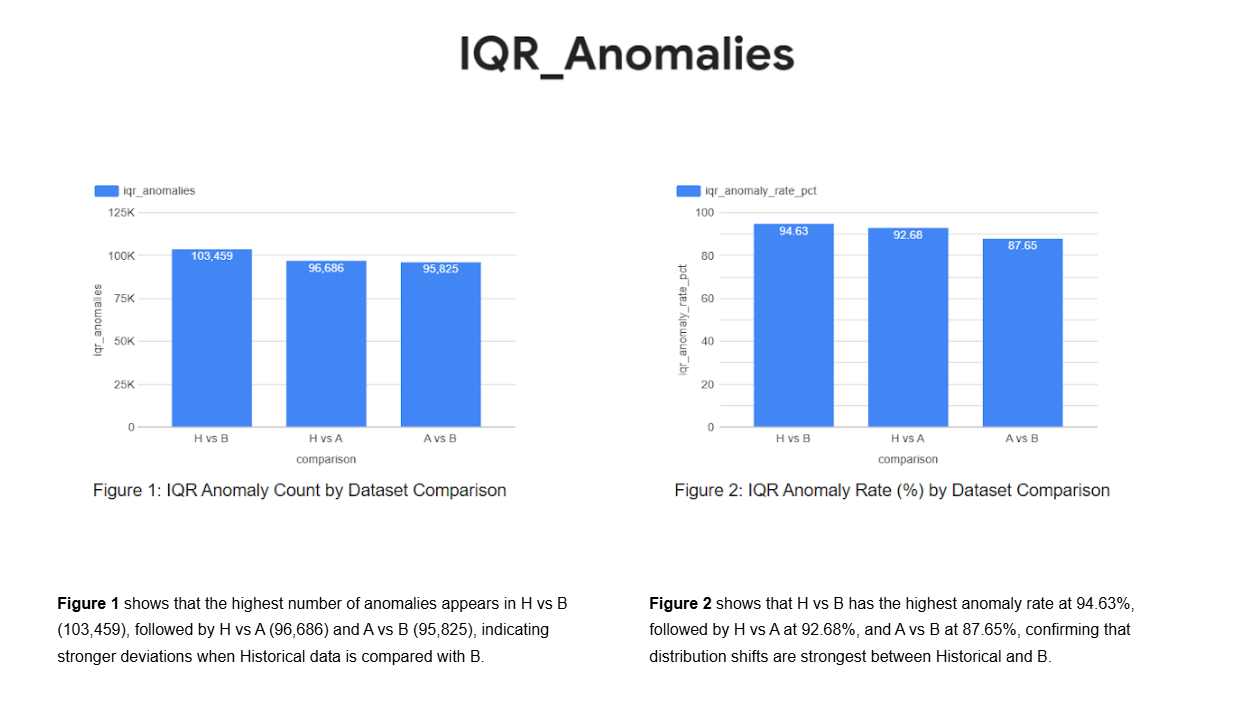
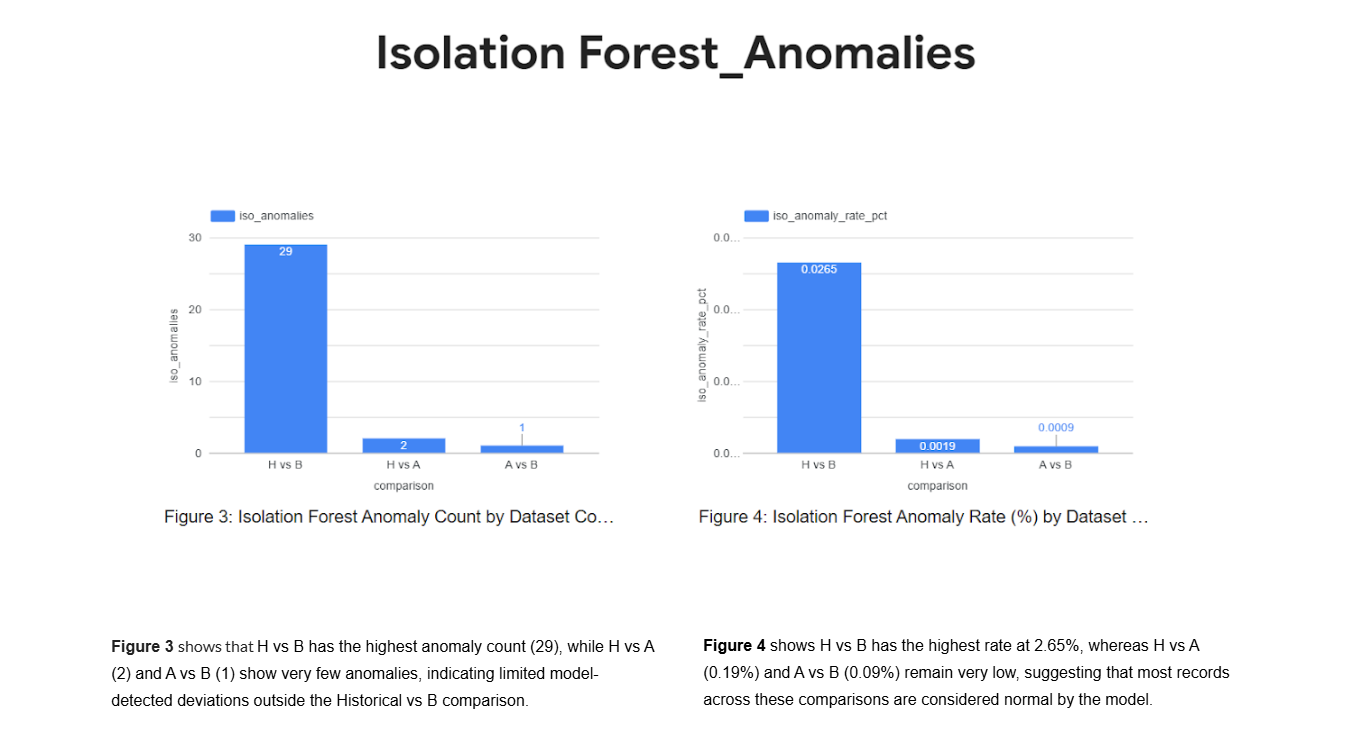
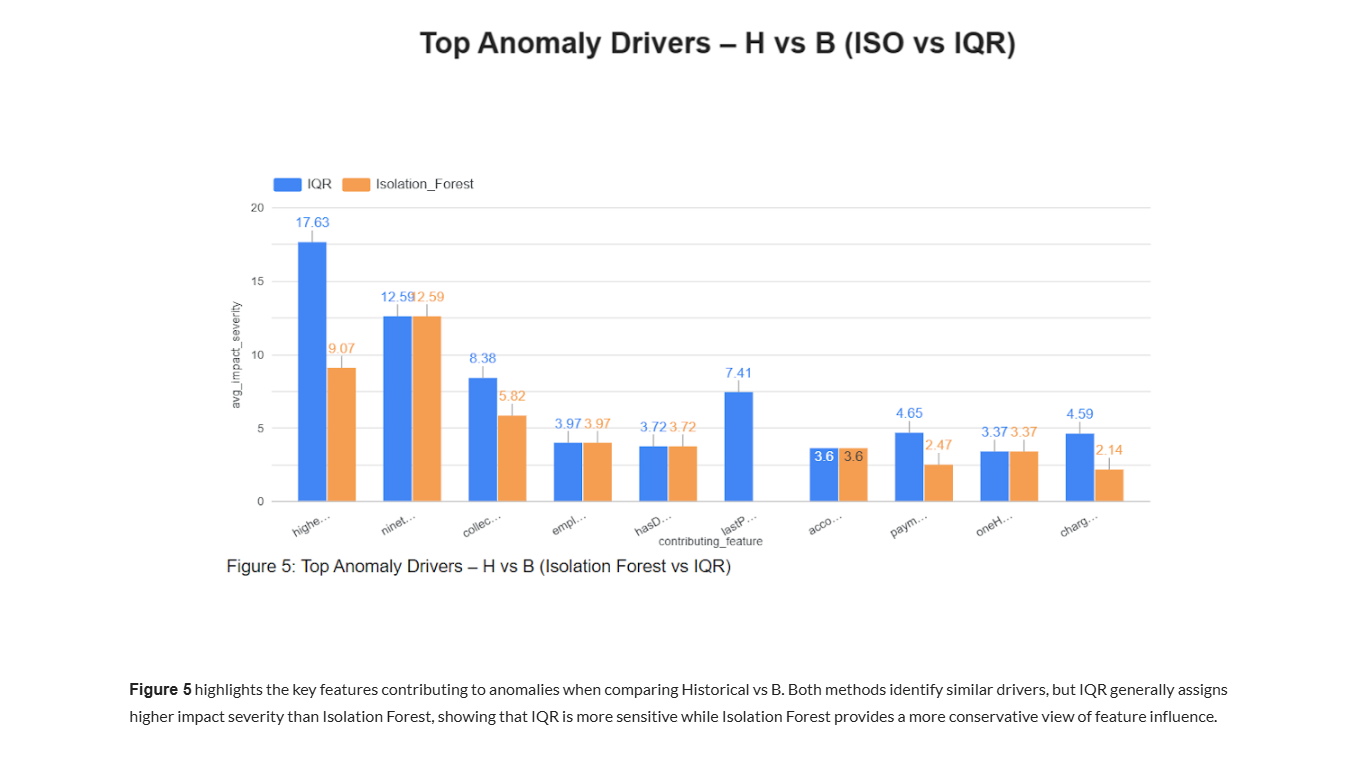
Step-7 : Isolation Forest & IQR Anomaly Detection (M1_HAB_ISO_IQR.py)
Runs Isolation Forest and IQR-based outlier detection across H–A–B datasets to identify global and statistical anomalies in entity behavior.
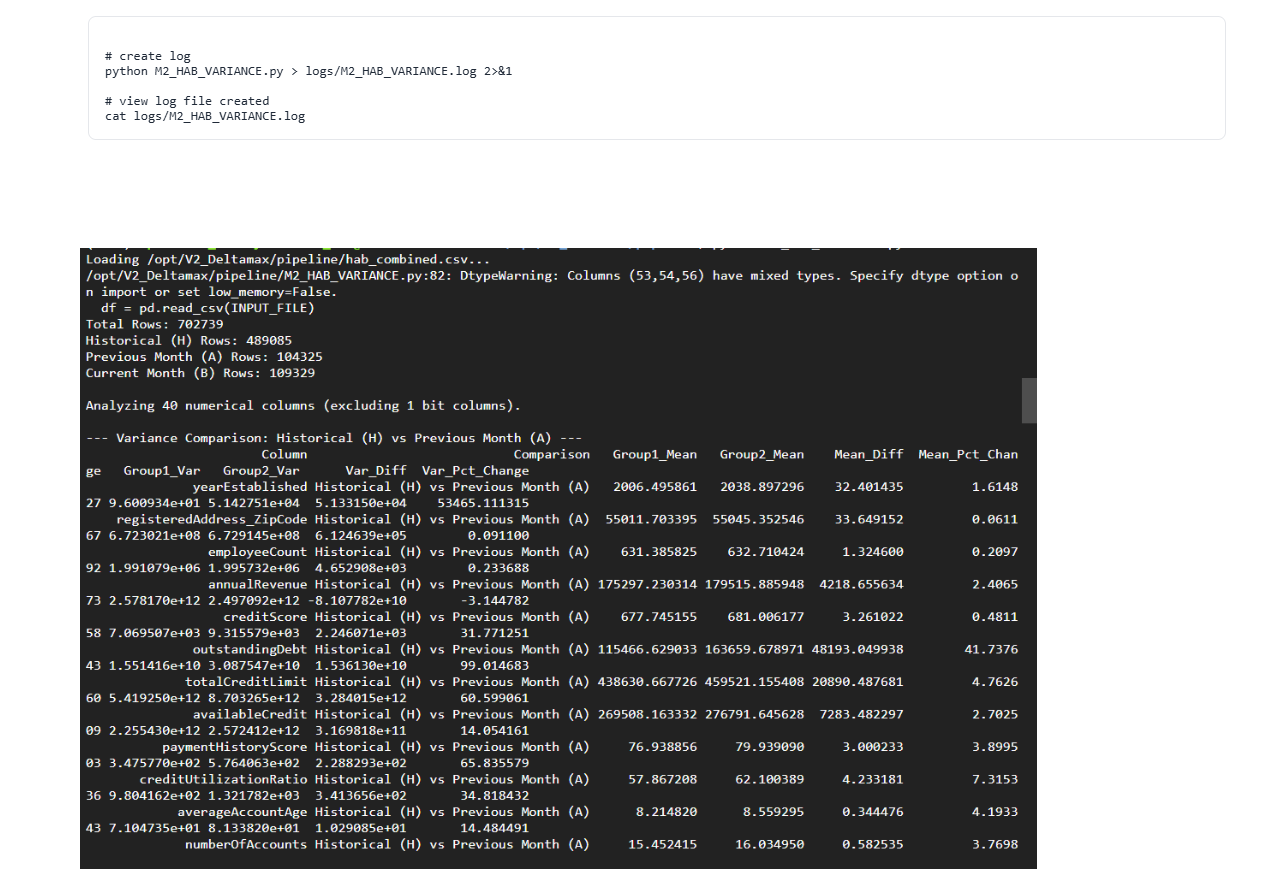
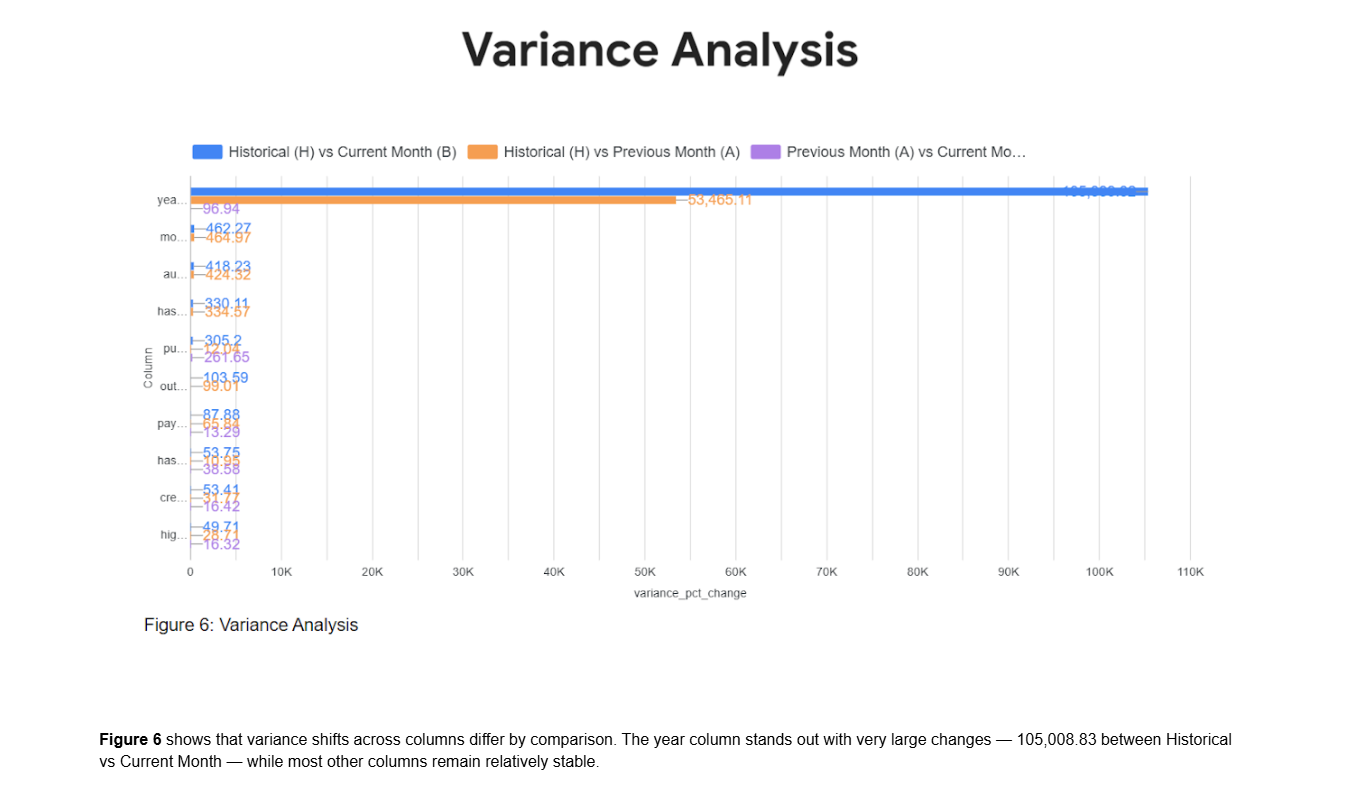
Step-8 : Variance Drift Analysis (M2_HAB_VARIANCE.py)
Measures variance shifts across H–A–B periods to detect distribution instability and structural data changes.
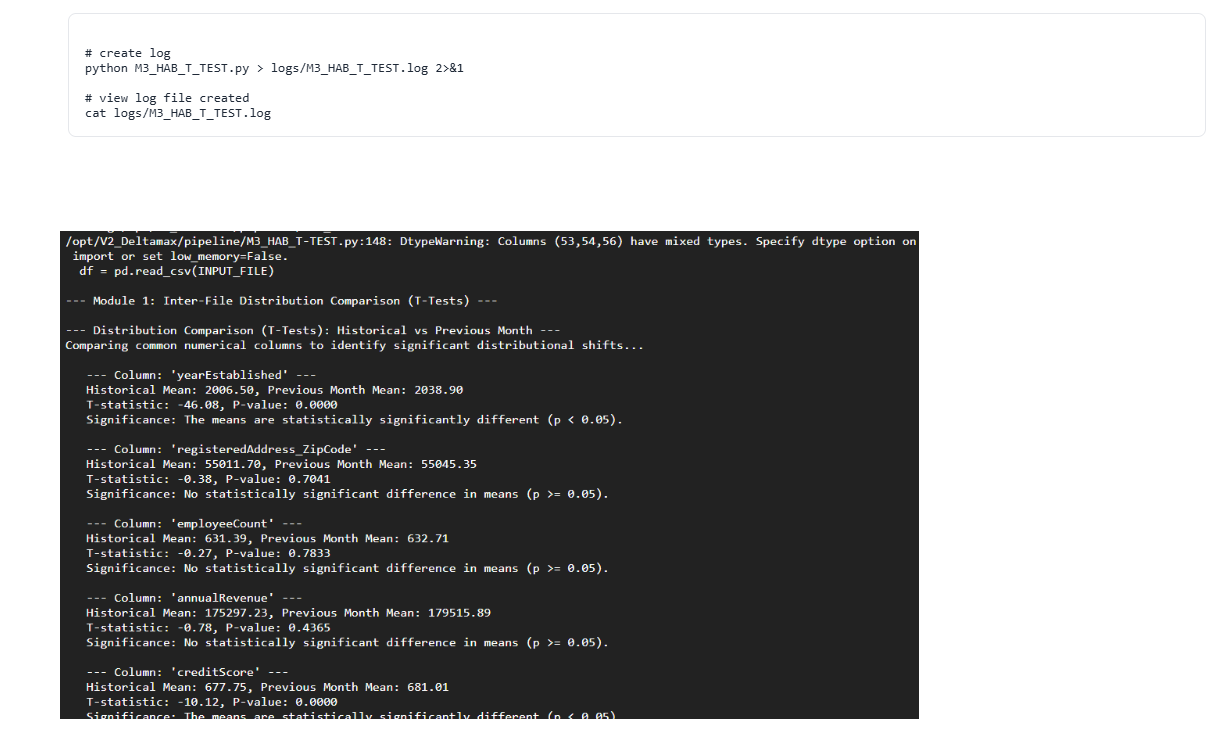
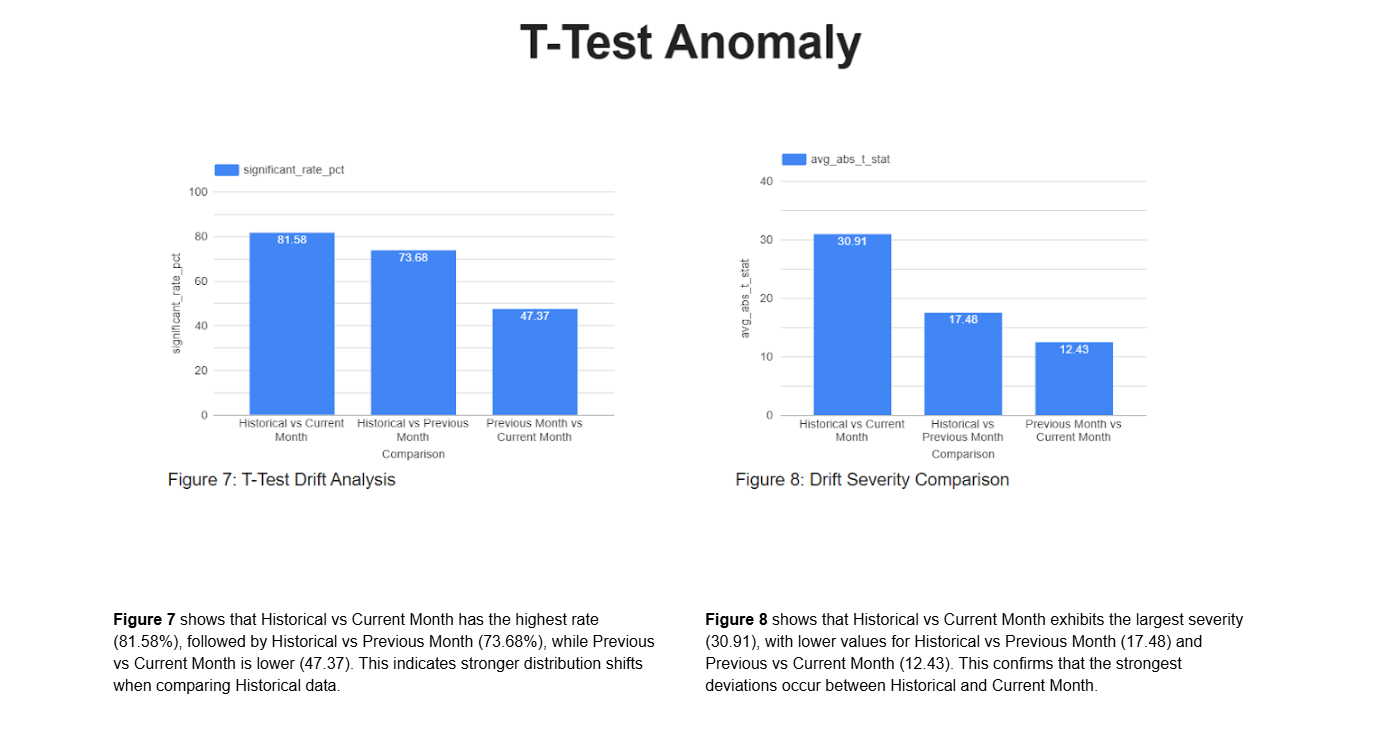
Step-9 : Statistical T-Test Drift Detection (M3_HAB_T_TEST.py)
Performs Welch’s T-test across periods to detect statistically significant mean shifts between Historical, Previous, and Current datasets.
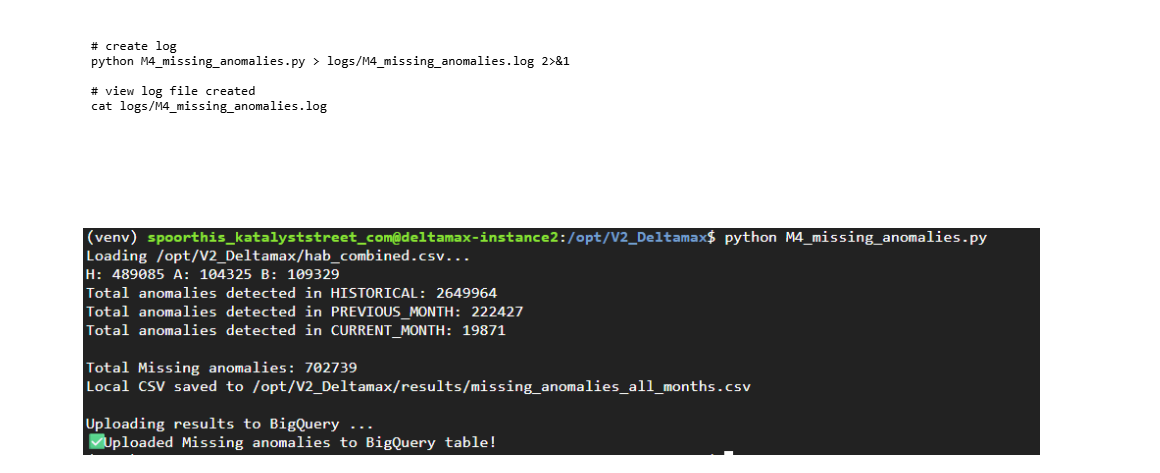
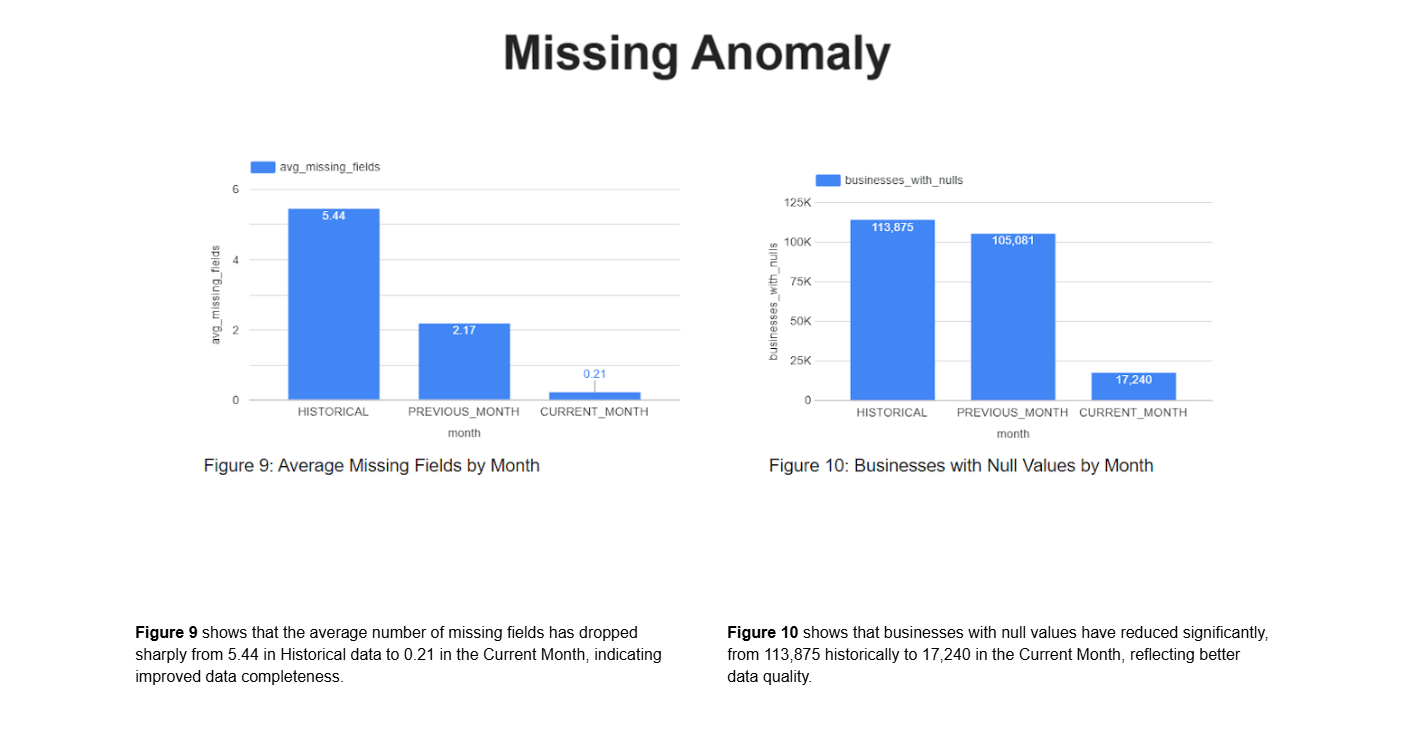
Step-10 : Missing Value Anomaly Detection (M4_missing_anomalies.py)
Identifies abnormal missingness patterns in the current dataset compared to historical benchmarks.
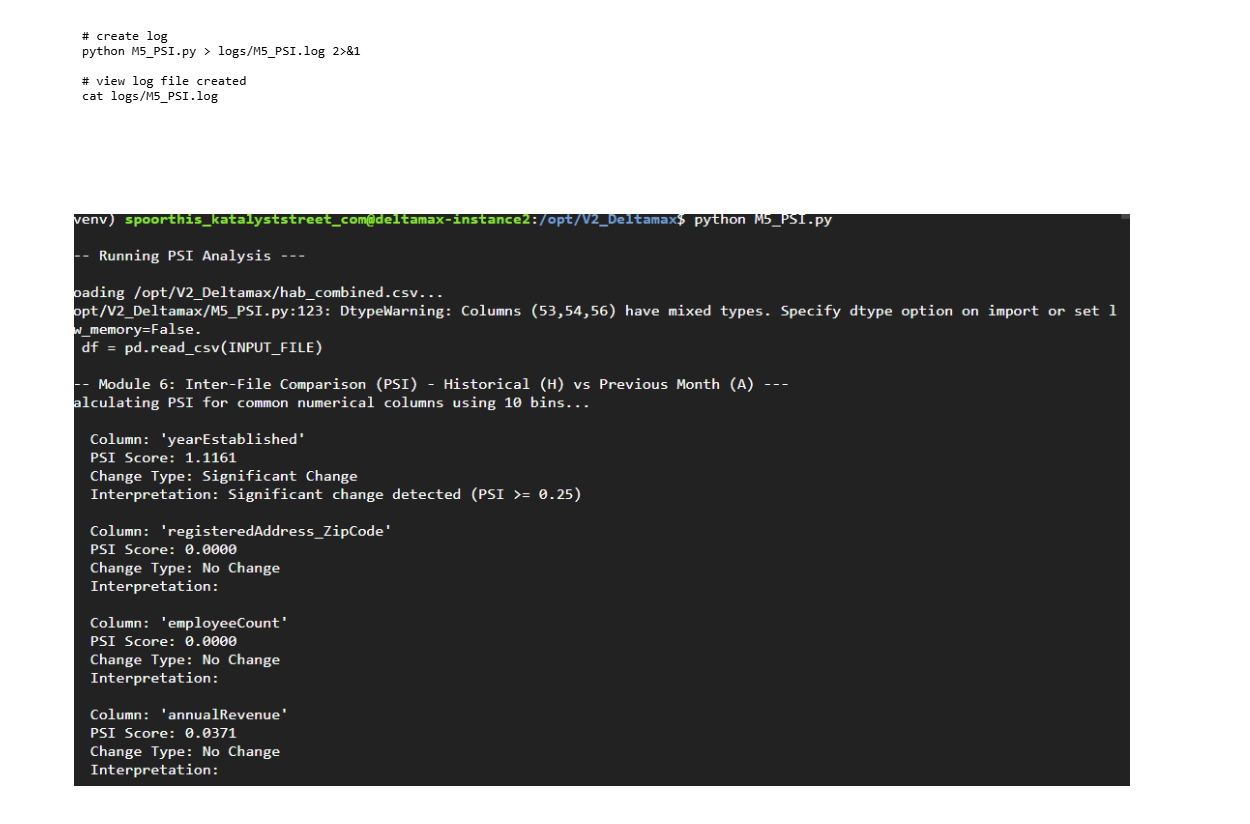
Step-11 : Population Stability Index (PSI) Analysis (M5_PSI.py)
Calculates PSI scores to quantify distribution drift between H–A–B datasets and measure population stability.
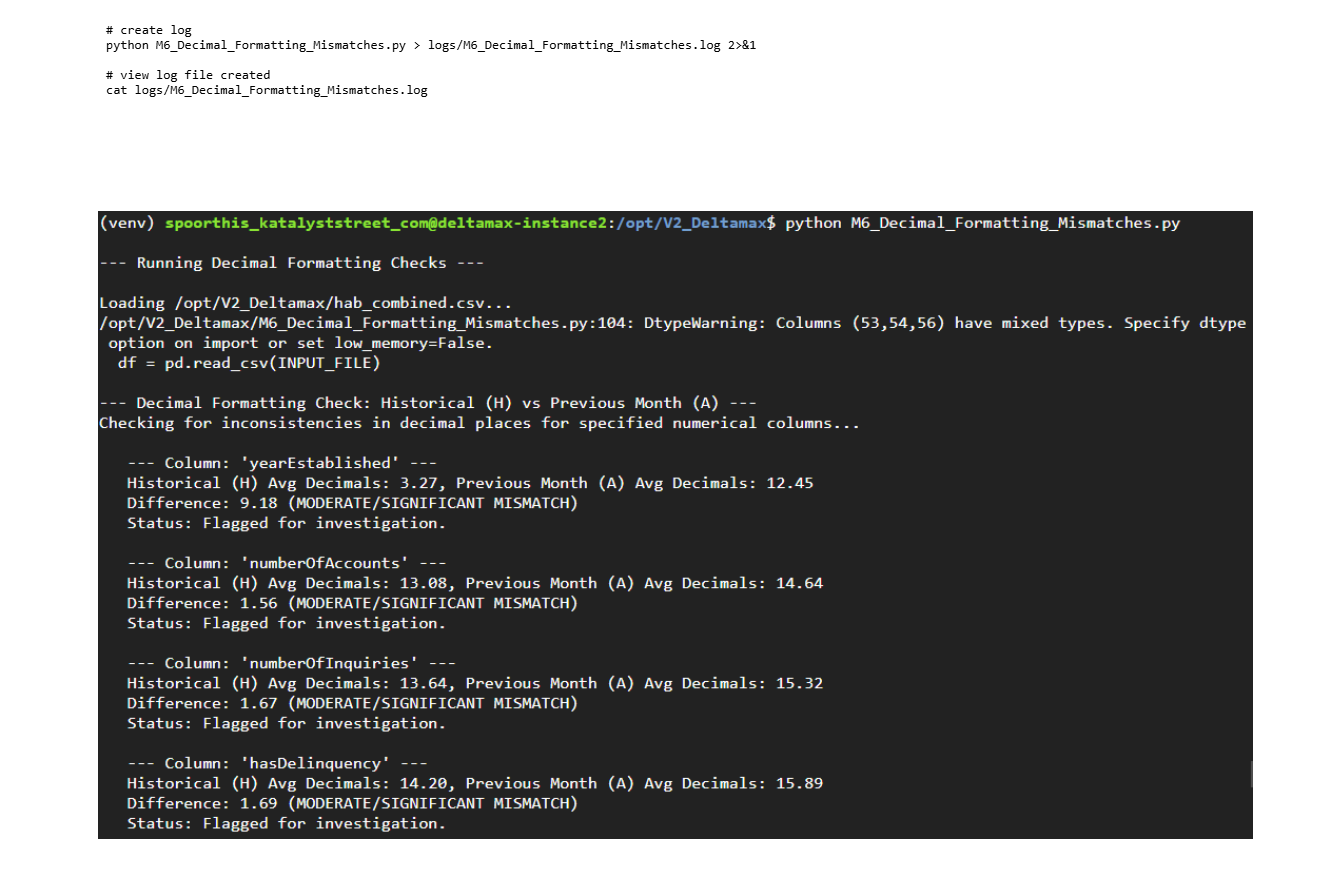
Step-12: Decimal Formatting Mismatch Detection (M6_Decimal_Formatting_Mismatches.py)
Detects numeric precision and decimal formatting inconsistencies between historical and current datasets.
Step-14: Detects numeric precision and decimal formatting inconsistencies between historical and current datasets.
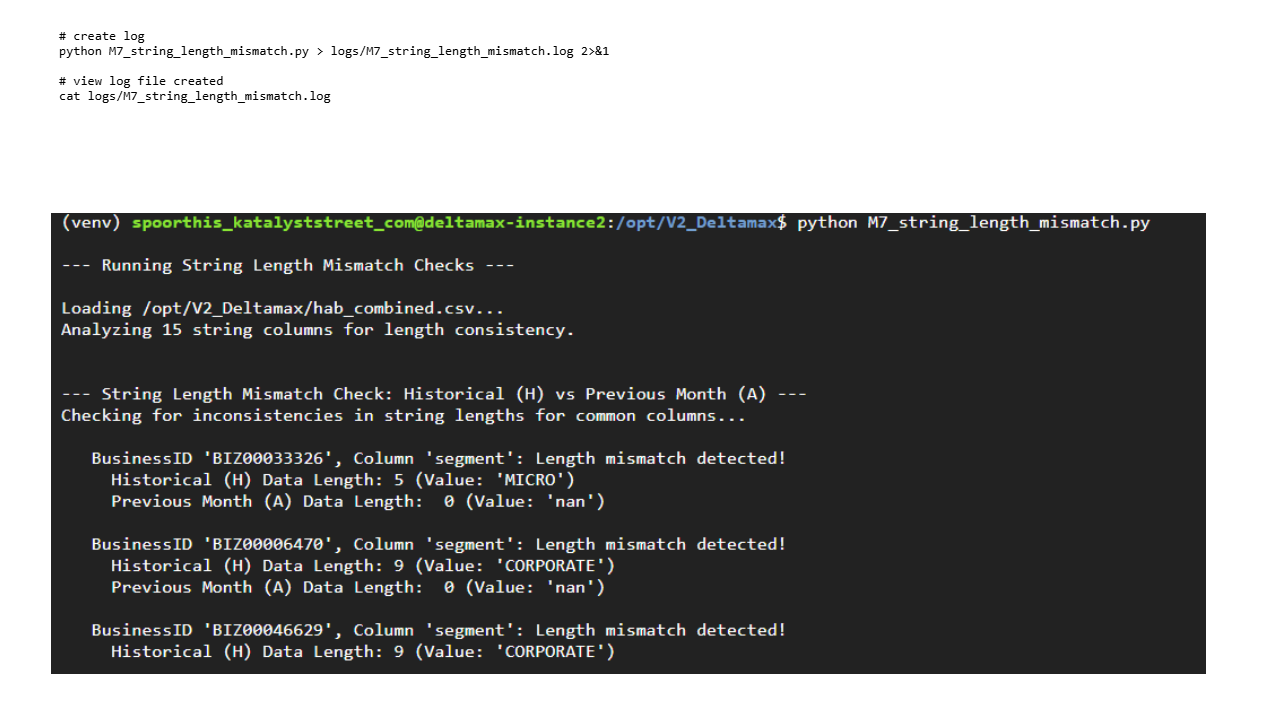
Validates string field consistency by detecting abnormal length deviations across structured text attributes.
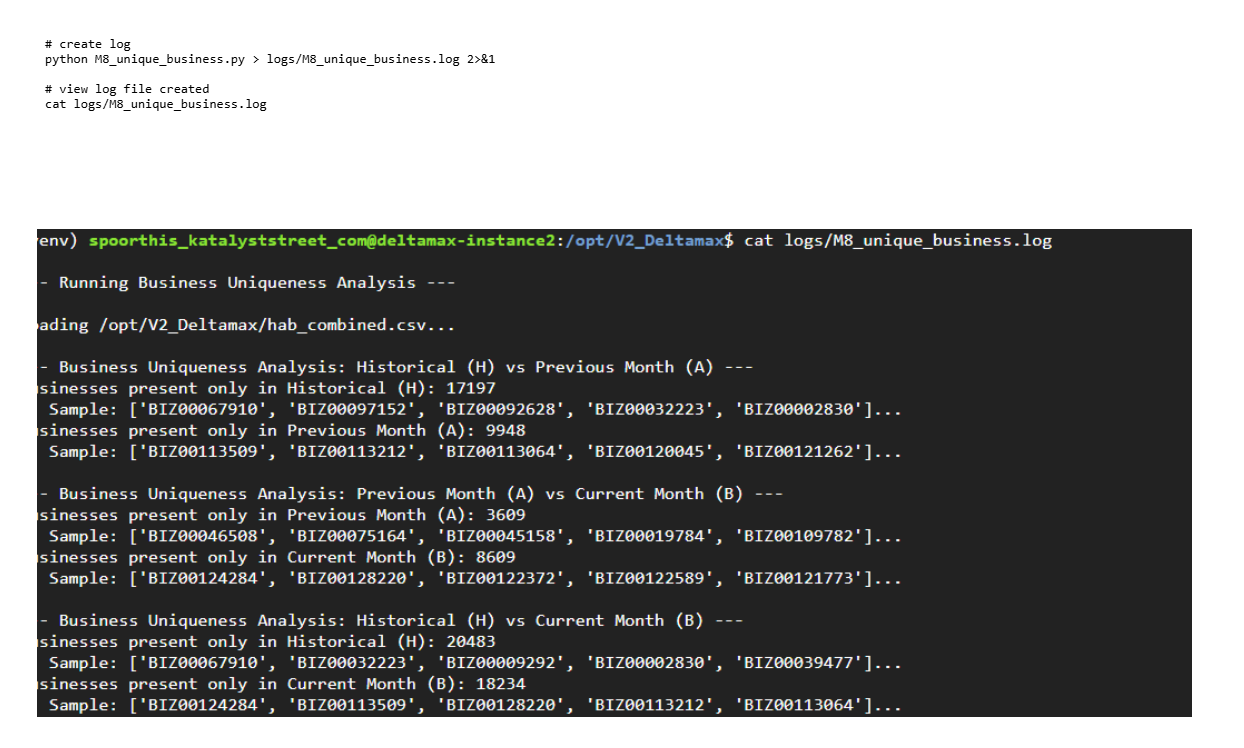
Step-15:Unique Business Integrity Check (M8_unique_business.py)
Ensures entity uniqueness and detects duplicate or conflicting business identifiers across H–A–B datasets.
Visualization & Agentic Intelligence
Step-24: Visualization through Looker Studio
Note: This visualization is an example of how the data can be perceived using our generated datasets on Looker. It is intended to illustrate potential insights and patterns rather than represent finalized outputs.
For customized dashboards and tailored reporting, please reach out to Katalyststreet to help visualize your outputs effectively.
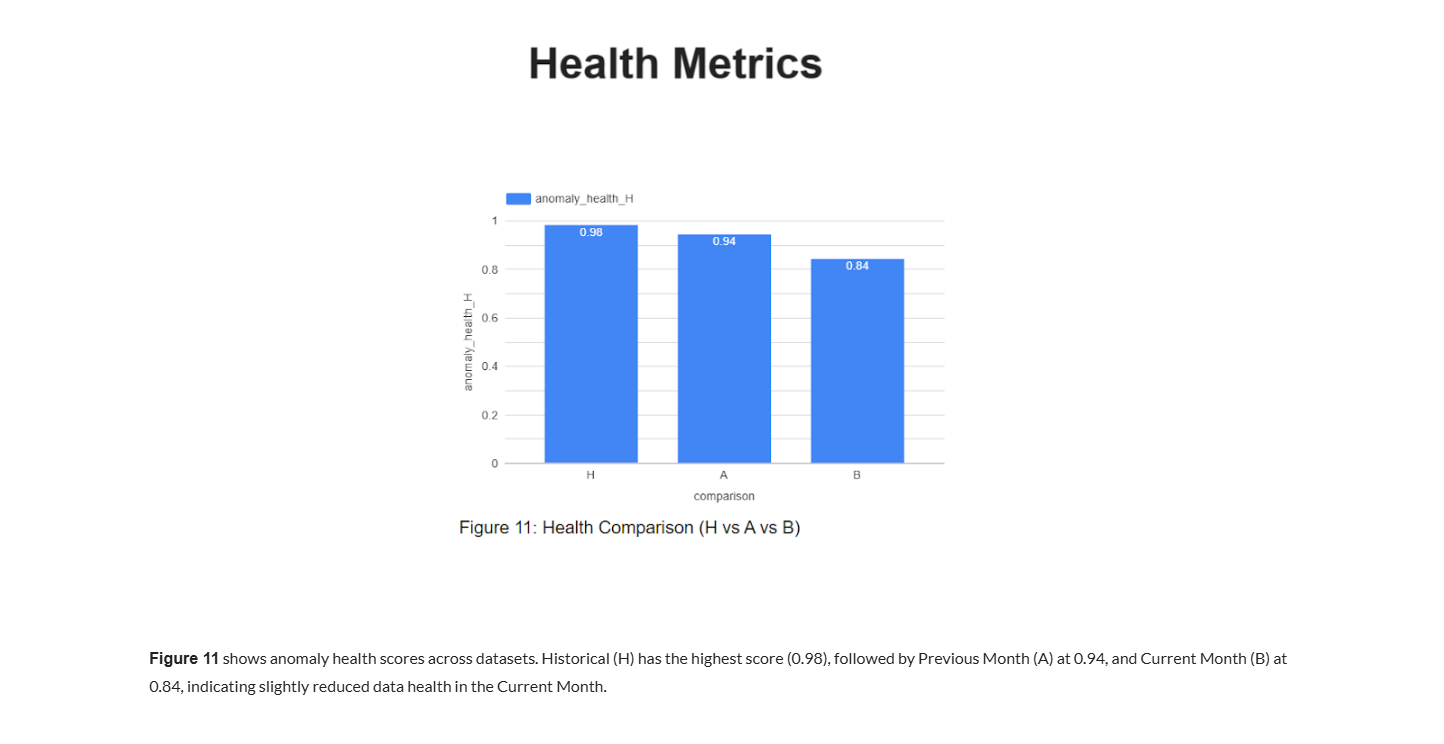
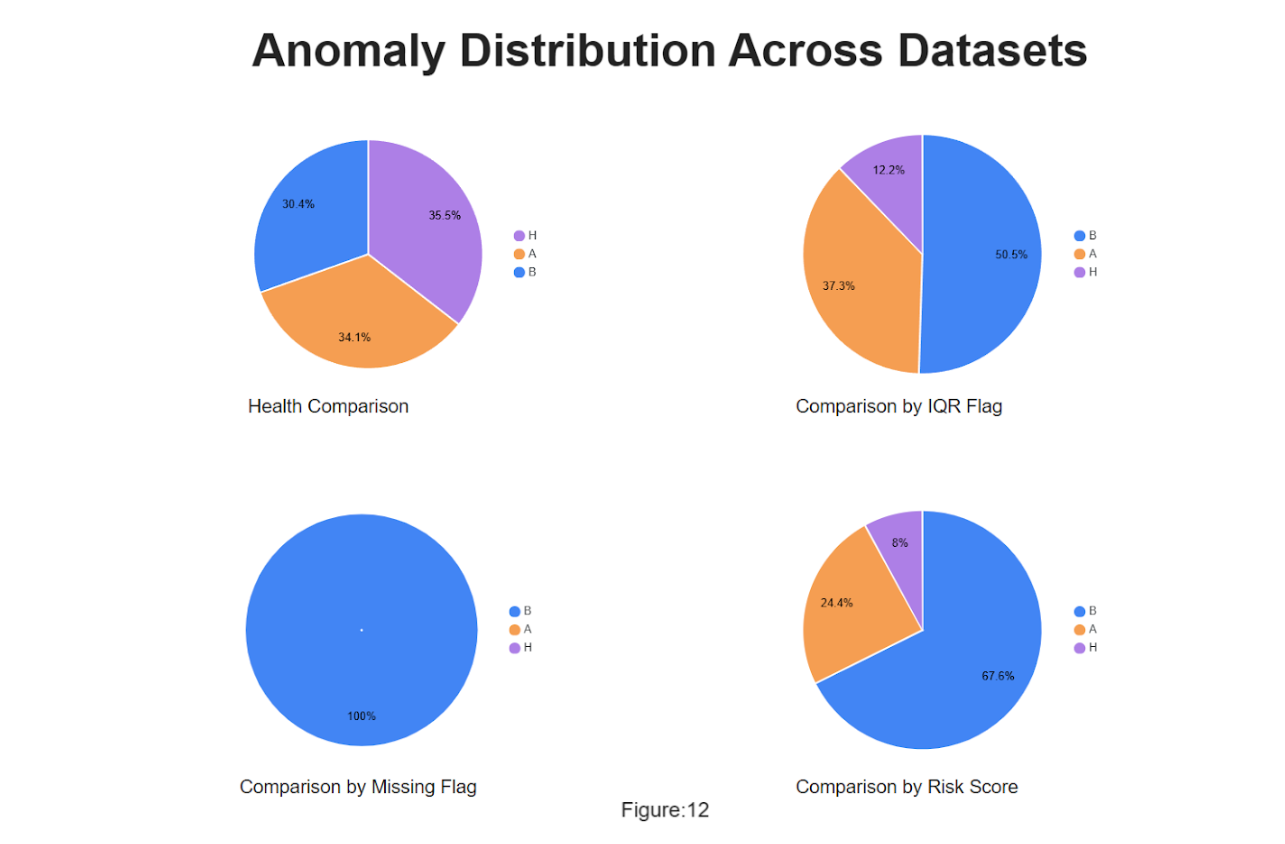
Health Comparisonshows that health scores are distributed across datasets with H (35.5%), A (34.1%), and B (30.4%), indicating relatively balanced health but a slightly lower share for B.
Comparison by IQR Flagshows that anomalies flagged by the IQR method are concentrated in B (50.5%), followed by A (37.3%), while H contributes the least (12.2%).
Comparison by Missing Flagshows that missing data is entirely concentrated in B (100%), with no missing values in H or A.
Comparison by Risk Score shows that risk scores are highest in B (67.6%), moderate in A (24.4%), and minimal in H (8%), suggesting elevated risk in the current dataset.


- Get Started
- Careers
- Contact Us
- Updates
- Blogs